
Athletics
61-91 · 4th in AL West, 15 GB
Offense cooling latelyLHP Jeffrey Springs · Pitches to contact
@

Tampa Bay Rays
92-59 · 1st in AL East
Offense cooling latelyRHP Drew Rasmussen · High-strikeout arm · plus control
Team Identity
Athletics
Season-to-date, 152 games, 5,934 PA.
An opportunistic offense that cashes in scoring chances, though it can be station-to-station. The offense has cooled off recently.
PowerAverage62
ContactAverage60
Plate DisciplineBelow Avg35
SpeedBelow Avg32
RISPAbove Avg73
Recent FormTrending Down
Walk rate is down 32% over the team's last 10 games versus its season baseline.
Tampa Bay Rays
Season-to-date, 151 games, 5,952 PA.
A contact-oriented, opportunistic offense that puts the ball in play and avoids empty at-bats, though it can be free-swinging. The offense has cooled off recently.
PowerBelow Avg36
ContactElite96
Plate DisciplineBelow Avg27
SpeedAbove Avg67
RISPAbove Avg78
Recent FormTrending Down
Walk rate is down 18% over the team's last 10 games versus its season baseline.
What This Game Is About
Biggest Advantage
Rays bring the more contact-oriented profile, while Athletics lean on being opportunistic.
Swing Factor
Jeffrey Springs strikes hitters out at a 17.2% clip (20th percentile); Rays carry a 17.5% strikeout rate.
Momentum
Athletics are trending down and Rays are trending down over their last 10 games.
Key Matchups
Can Jeffrey Springs miss enough bats?
Jeffrey Springs strikes hitters out at a 17.2% clip (20th percentile); Rays carry a 17.5% strikeout rate.
Edge · RaysJeffrey Springs: 17.2% K rateRays: 17.5% K rateHigh confidence
Can Drew Rasmussen miss enough bats?
Drew Rasmussen strikes hitters out at a 24.4% clip (73rd percentile); Athletics carry a 21.8% strikeout rate.
Edge · AthleticsDrew Rasmussen: 24.4% K rateAthletics: 21.8% K rateHigh confidence
Can Jeffrey Springs limit Rays' power?
Rays rank in the 36th percentile in extra-base production, while Jeffrey Springs sits in the 4th percentile at suppressing total bases.
Edge · RaysRays: 0.346 TB/PAJeffrey Springs: 0.452 TB/PA allowed (609 PA)High confidence
How do Rays handle left-handers?
Rays have produced worse against left-handers this season (0.318 vs. 0.346 TB/PA overall).
Edge · Jeffrey Springsvs left-handers: 0.318 TB/PA (1849 PA)overall: 0.346 TB/PAModerate confidence
Can Jeffrey Springs command the strike zone?
Rays walk in 8.0% of trips; Jeffrey Springs allows walks at a fairly typical rate (8.9%).
Edge · Jeffrey SpringsRays: 8.0% walk rateJeffrey Springs: 8.9% walks allowedHigh confidence
Pitcher Trends

Jeffrey Springs
Athletics · 8 starts
Strikeouts2.6/start
Hits allowed5.0/start
4 or fewer Strikeouts — 4 of last 66 or fewer Hits Allowed — 5 of last 6
17% K ratePer-start form only — opponent lineup, park, and pitch count aren't modeled.

Drew Rasmussen
Tampa Bay Rays · 8 starts
Strikeouts6.0/start
Hits allowed4.4/start
4 or fewer Hits Allowed — 4 of last 65 or fewer Strikeouts — 4 of last 6
24% K ratePer-start form only — opponent lineup, park, and pitch count aren't modeled.
Player Trends
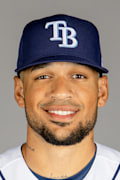
Victor Mesa Jr.
Tampa Bay Rays · 0.351 hit rate · 0.703 TB/PA
recent games · 1+ hit
L53 / 5L108 / 10L2515 / 25
Total bases per PA is up 90% over his prior baseline, with hits in 8 of his last 10 games. He has trimmed his strikeout rate to 11%.
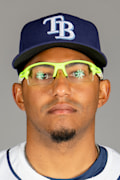
Richie Palacios
Tampa Bay Rays · 0.280 hit rate · 0.640 TB/PA
recent games · 1+ hit
L53 / 5L107 / 10L2515 / 25
Total bases per PA is up 122% over his prior baseline, with hits in 6 of his last 8 games. He has trimmed his strikeout rate to 12%.

Tommy White
Athletics · 0.294 hit rate · 0.471 TB/PA
recent games · 1+ hit
L53 / 5L105 / 10L2515 / 25
Total bases per PA is up 53% over his prior baseline, with hits in 3 of his last 6 games. He has trimmed his strikeout rate to 12%.

Jonah Heim
Athletics · 0.087 hit rate · 0.087 TB/PA
recent games · 1+ hit
L52 / 5L106 / 10L2512 / 25
Total bases per PA is down 76% over his prior baseline, with hits in 2 of his last 6 games. His strikeout rate has climbed to 26%.
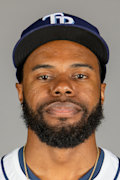
Cedric Mullins
Tampa Bay Rays · 0.100 hit rate · 0.100 TB/PA
recent games · 1+ hit
L51 / 5L104 / 10L2512 / 25
Total bases per PA is down 66% over his prior baseline, with hits in 2 of his last 6 games.

Ryan Vilade
Tampa Bay Rays · 0.125 hit rate · 0.125 TB/PA
recent games · 1+ hit
L52 / 5L103 / 10L259 / 25
Total bases per PA is down 70% over his prior baseline, with hits in 2 of his last 6 games. His strikeout rate has climbed to 44%.
Players Positioned to Succeed
77

Jeff McNeil
1+ Hit
Athletics
Why it stands out
Batting 2nd, confirmed lineup
No notable risk
76
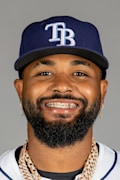
Junior Caminero
1+ Hit
Tampa Bay Rays
Why it stands out
Batting 3rd, confirmed lineup
No notable risk
75
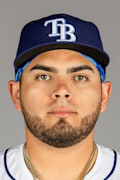
Jonathan Aranda
1+ Hit
Tampa Bay Rays
Why it stands out
Batting 2nd, confirmed lineup
Main risk
Elevated recent strikeout rate
72
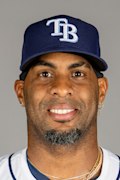
Yandy Diaz
1+ Hit
Tampa Bay Rays
Why it stands out
Batting 1st, confirmed lineup
Main risk
Ice cold — 2 hits in the last 25 plate appearances
71
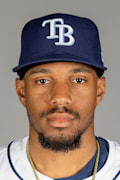
Chandler Simpson
1+ Hit
Tampa Bay Rays
Why it stands out
Batting 6th, confirmed lineup
No notable risk
66

Henry Bolte
1+ Hit
Athletics
Why it stands out
Batting 1st, confirmed lineup
Main risk
Elevated recent strikeout rate
Expected Game Shape
BalancedLow confidence
Competitive profile without a clear stylistic tilt. Athletics bring more power.
Early edge Rays Driver No single dominant factor Volatility Moderate
- Both probable starters grade around the 53rd percentile in combined suppression.
- Athletics are trending down; Rays are trending down.
Storylines to Watch
Is Victor Mesa Jr. the one to watch?
Victor Mesa Jr. enters as Rays' hottest bat. Total bases per PA is up 90% over his prior baseline, with hits in 8 of his last 10 games. He has trimmed his strikeout rate to 11%.
0.351 hit rate · 0.703 TB/PA · 0.187 hit rate · 0.369 TB/PA
Can Jonah Heim snap out of it?
Jonah Heim has cooled off. Total bases per PA is down 76% over his prior baseline, with hits in 2 of his last 6 games. His strikeout rate has climbed to 26%.
0.087 hit rate · 0.087 TB/PA · 0.195 hit rate · 0.356 TB/PA
Based on plate appearances before 2026-09-17, with today's posted lineups when available. Injuries, weather, bullpen availability, and park factors are not yet included.